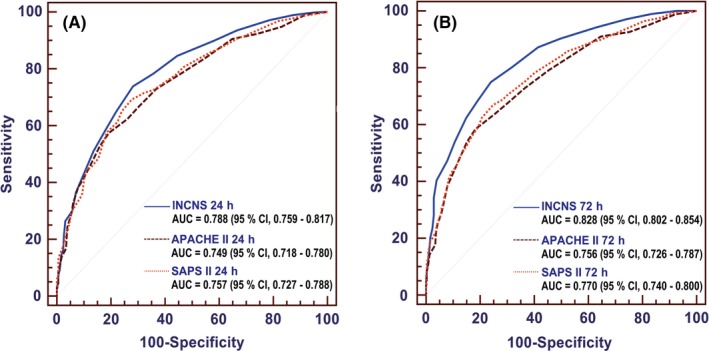
Figure 2.

Comparisons of area under the receiver operating characteristic curve (AUC) for INCNS, Acute Physiology and Chronic Health Evaluation II (APACHE II) and Simplified Acute Physiology Score II (SAPS II) to discriminate the 3‐mo functional outcome in neurocritically ill patients. A, ROC at 24 h: the P value for the comparison of AUC between INCNS and APACHE II is 0.0011, between INCNS and SAPS II is 0.0117. B, ROC at 72 h: the P value for the comparison of AUC between INCNS and APACHE II is <0.0001, between INCNS and SAPS II is also <0.0001. Level of significance corrected for multiple testing P < 0.0167
