
Figure 5.
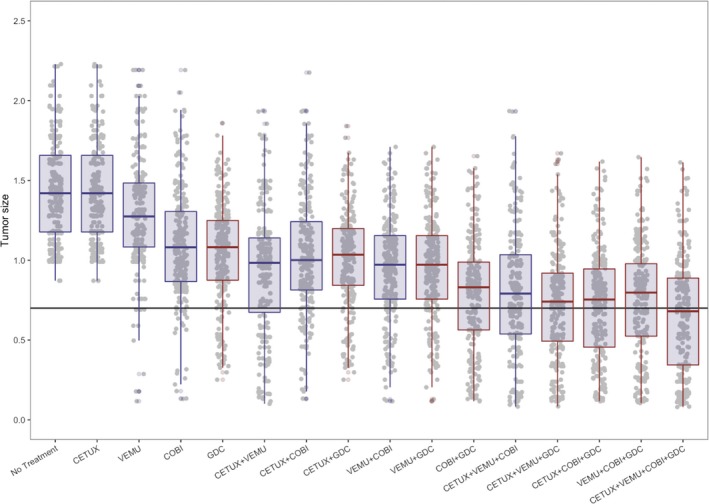
Effect of different drug combinations on tumor size. Normalized tumor size at week 8 is plotted against each of the 16 corresponding drug combinations. Gray dots and overlaid boxplots represent simulated tumor sizes with combinations containing GDC highlighted in red. Horizontal black line represents tumor size reduction of 30%. CETUX, cetuximab; COBI, cobimetinib; GDC, GDC‐0994; VEMU, vemurafenib.