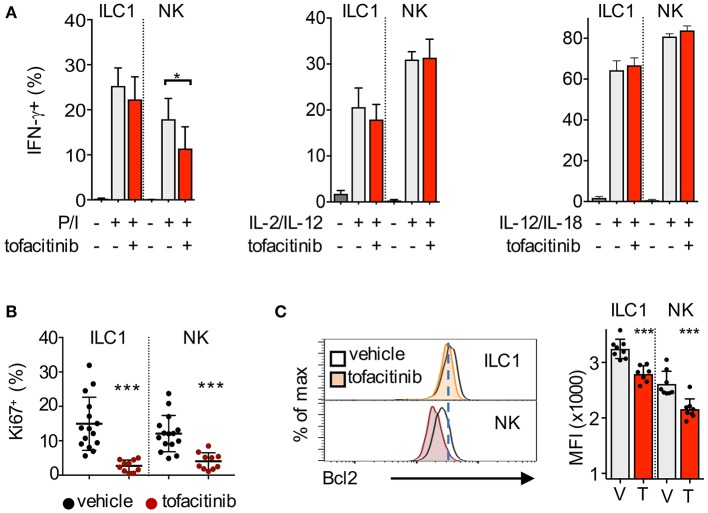
Figure 4.
Impact of tofacitinib treatment on the functions of NK cells and ILC1. (A) Bar graphs show the percentage of IFN-γ-positive ILC1 and NK cells, quantified by flow cytometry, after 2 h stimulation with PMA/Ionomycin (P/I), or 6 h stimulation with IL-2/IL-12 or IL-12/IL-18, in mice treated or not for 1 week with tofacitinib. Two experiments were combined. (B) Percentage of Ki67-positive ILC1 and NK cells isolated from liver after 7 days administration of tofacitinib or vehicle. (C) Representative histogram plots (left panel) and bar graphs (MFI, right panel) show Bcl2 protein expression in ILC1 and NK cells from mice treated with tofacitinib or vehicle. *P < 0.05; ***P < 0.001.

