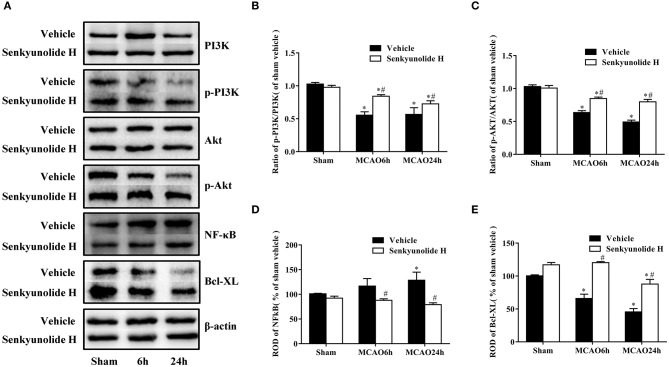
Figure 7.
Effect of SEH treatment on changes of PI3K/Akt/NF-κB signaling pathway and antiapoptotic levels in the hippocampus region. (A) Protein bands of PI3K, p-PI3K, Akt, p-Akt, NF-κB, and Bcl-XL in each group. (B) The ratio of p-PI3K/PI3K. (C) The ratio of p-Akt/Akt. (D) NF-κB expression. (E) Bcl-XL expression. Relative optical density (ROD) as a percentage of the immunoblot band is presented (n = 7 per group; *p < 0.05: significantly different from the corresponding sham group; #p < 0.05: significantly different from the corresponding vehicle-MCAO group). Bars indicate mean ± SD.

