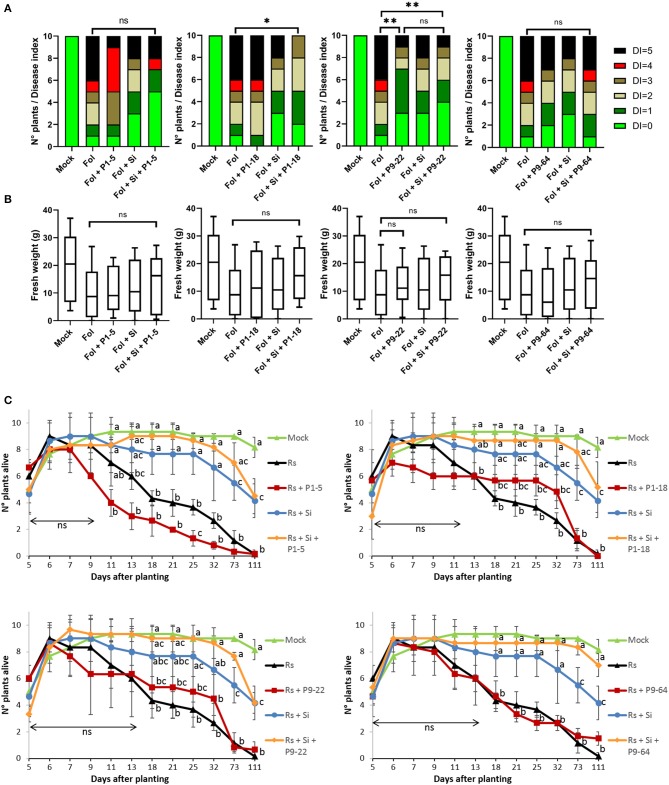
Figure 5.
Effect of isolates in combination or not with Serendipita indica (Si) on tomato plants against fungal pathogens. (A,B) Biocontrol of Fusarium oxysporum (Fol). (A) Disease index (DI) score. (B) Fresh weight (FW). Boxes represent standard deviation with median. Whiskers represent the Min to Max of all the values. Analysis of FW and DI was performed using the non-parametric Mann–Whitney U-test (*P < 0.05, **P < 0.01, ns = non significant; n = 10); (C) biocontrol of Rhizoctonia solani (Rs). Points represent mean values, and whiskers standard deviations. Same letters represent non-significantly different mean values, according to Tukey's test (P < 0.05) after ANOVA (n = 3). ns, non significant.

