
Figure 1.
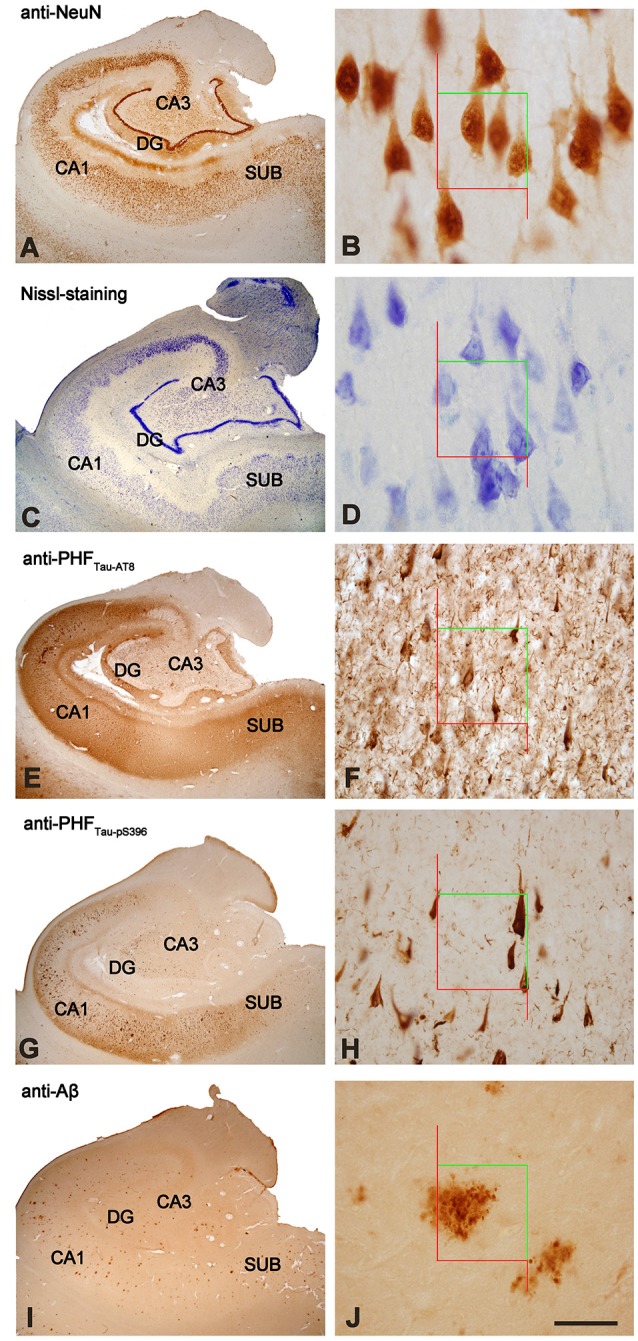
Stained hippocampal formation sections from an AD patient. Left column, low-power microphotographs of the hippocampal formation showing NeuN-ir (A), Nissl-staining (C), PHFTau-AT8-ir (E), PHFTau-pS396-ir (G) and Aβ-ir (I) sections. Right column (B,D,F,H,J), higher magnification of CA1 region to illustrate the applied counting frame (green lines correspond to the inclusion border and red lines to the exclusion border) used in the stereological procedure. Scale bar, shown in (J), indicates 1,000 μm in (A,C,E,G,I); 37 μm in (B,D); 90 μm in (F,H,J). DG: dentate gyrus; CA1-CA3: cornu ammonis fields; SUB: subiculum.