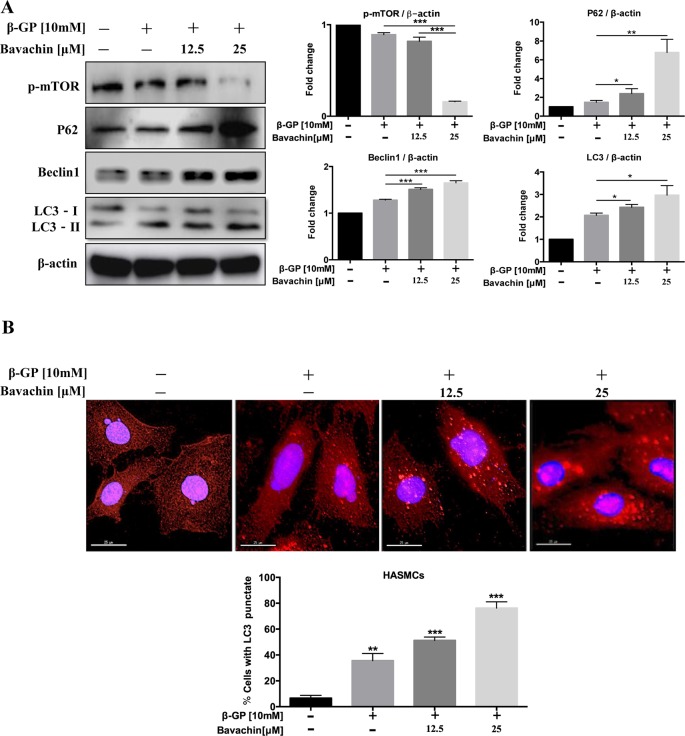
Figure 5.
Bavachin activates autophagy via mTOR signaling in HASMCs. (A) Western blot analysis of mTOR and autophagy-related proteins (p62, beclin1, and LC3) in bavachin and β-GP-treated HASMCs. The full-length images of Western blot are shown in Figure S5A . (B) Immunofluorescence analysis of LC3-II puncta formation (red color represents LC3-II, blue represents DAPI; scale bar = 25 μm). Statistical significance was analyzed by the one-way ANOVA (*P < 0.05, **P < 0.01, ***P < 0.001). The data is represented as mean ± S.D. (n = 3).

