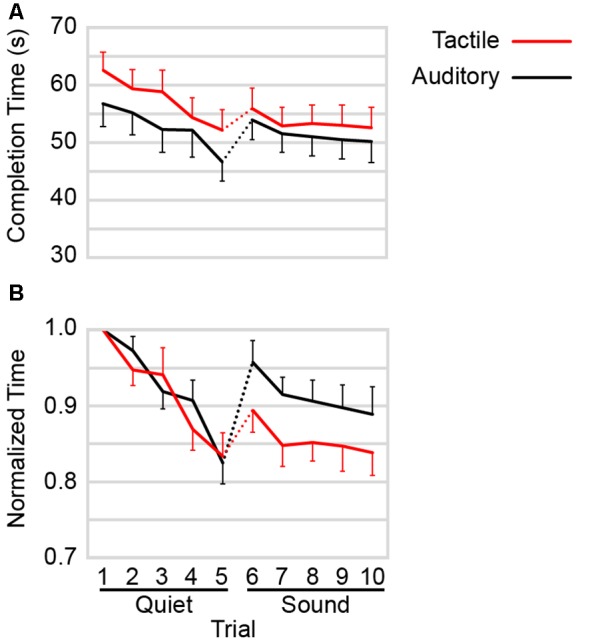
Figure 4.

(A) Mean completion time as a function of trial by command type. Data from Figure 2 were replotted by averaging across all participants (n = 12) for each condition. (B) Mean of completion times normalized against trial 1. For each participant, completion time on each trial was divided by the completion time from trial 1 of the corresponding command type. Red: tactile navigational commands. Black: auditory navigational commands. Dotted lines: background street sounds introduced into the experiment. For visual clarity, error bars show +1 SE and −1 SE, respectively for the highest and lowest points at each comparison distance.
