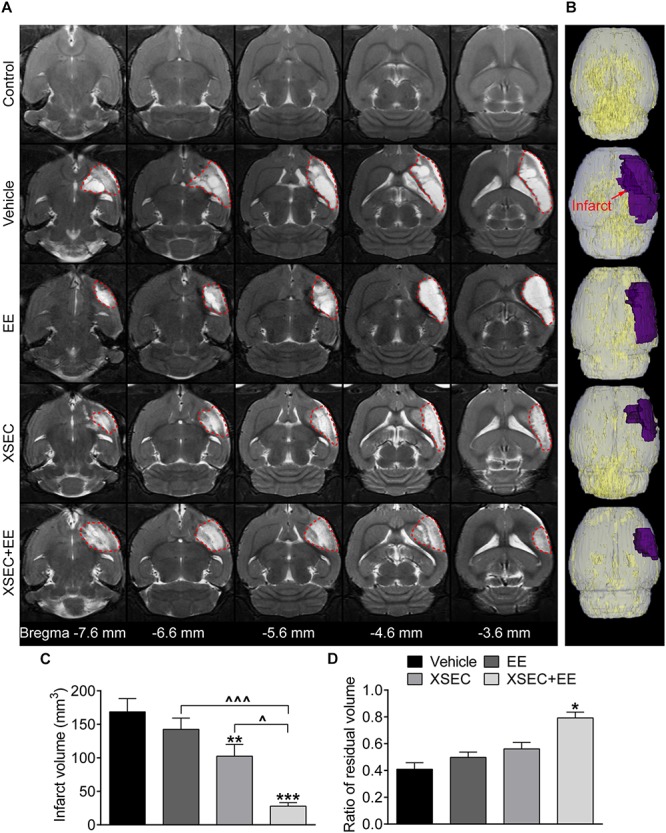
FIGURE 1.

Effect of XSEC or EE and their combination on the infarct volume in MCAO rats. (A) Representative axial T2 images (bregma –7.6 to –3.6 mm) obtained from various group rats on the 31st day after MCAO. The infarct tissues were surrounded by red dotted lines. (B) Typical 3D reconstruction images of ischemic lesion were acquired by 3D Slicer software (purple region indicated the infarction). (C,D) Quantitative analysis of the infarct volume and the ratio of residual volume, respectively (one-way ANOVA followed by Bonferroni’s post hoc test, n = 8 per group). ∗P < 0.05, ∗∗P < 0.01, ∗∗∗P < 0.001 vs. vehicle group. ∧P < 0.05, ∧∧∧P < 0.001 vs. XSEC + EE group.
