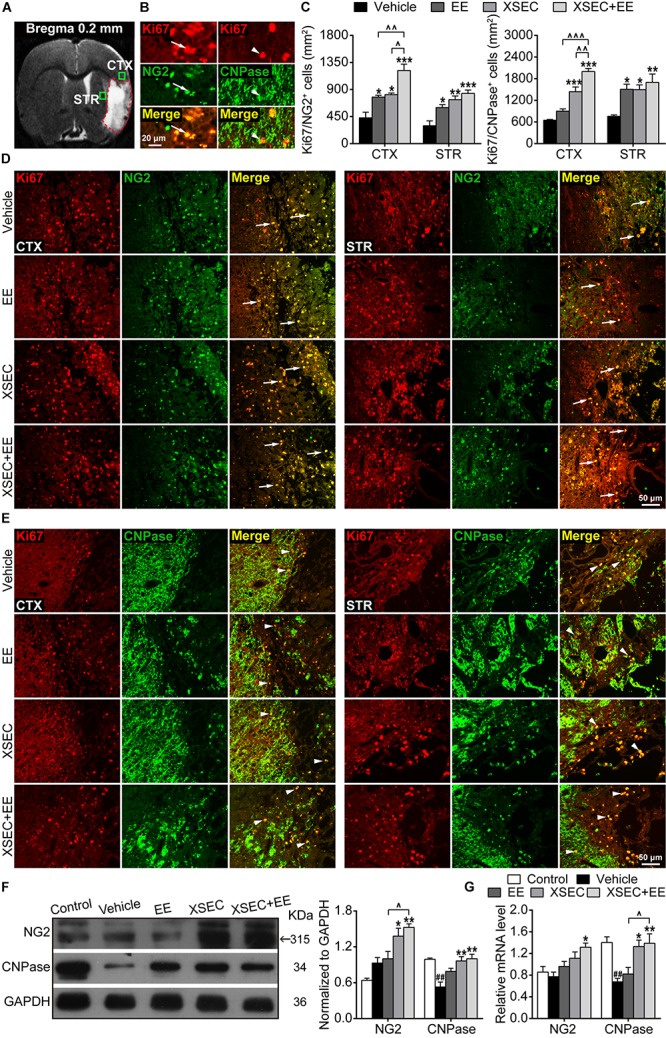
FIGURE 5.

Effect of XSEC or EE and their combination on oligodendrogenesis in MCAO rats. (A) A representative coronal T2WI image at the level of bregma 0.2 mm. Boxes indicated the peri-infarct cortex and striatum where images were taken. (B) Representative images showing the co-expressed cells of Ki67+/NG2+ and Ki67+/CNPase+. (C) Quantitative data of the number of Ki67+/NG2+ and Ki67+/CNPase+ co-expressed cells in the peri-infarct cortex and striatum. (D,E) Representative images of Ki67/NG2 and Ki67/CNPase double immunofluorescent staining in the peri-infarct cortex and striatum. (F,G) Quantitative analysis of the protein and mRNA level of NG2 and CNPase in the peri-infarct brain tissues, respectively (one-way ANOVA followed by Bonferroni’s post hoc test, n = 4 per group). ##P < 0.01 vs. control group. ∗P < 0.05, ∗∗P < 0.01, ∗∗∗P < 0.001 vs. vehicle group. ∧P < 0.05, ∧∧P < 0.01, ∧∧∧P < 0.001 vs. XSEC + EE group.
