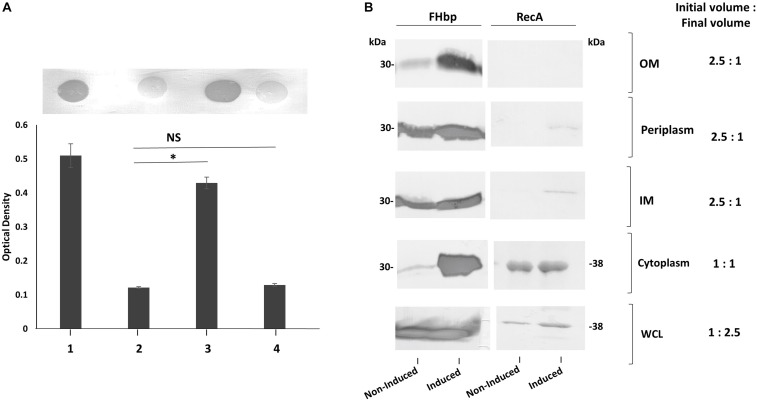
FIGURE 8.
The affect of increasing transcription of fHbp on FHbp subcellular localization and surface localization in L91543. (A) Immuno-dot blot of whole cells with JAR4. Lanes; 1, MC58, 2, L91543, 3, L91543ΔfHbp + LfHbp induced with IPTG, 4, L91543ΔfHbp + LfHbp non-induced. One representative experiment of 5 is shown. The optical density was measured by ImageJ. The ANOVA followed by Dunnett’s test was employed for statistical analysis in GraphPad (V. 6). All columns represent mean ± SEM, ∗p < 0.05 vs. strain L91543. (B) Western immunoblot with JAR4 of different subcellular compartments of strain L91543ΔfHbp + LfHbp non-induced versus induced. Equal protein loading was confirmed by the determination of RecA protein.

