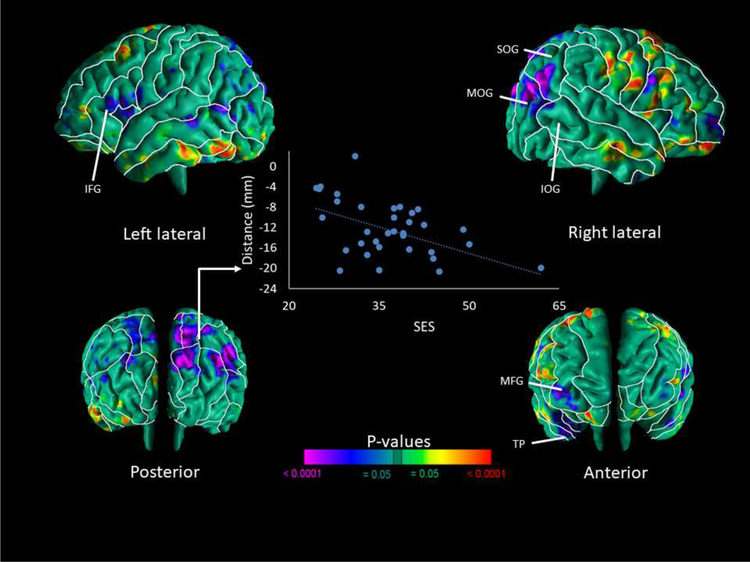
Figure 1. Correlation of Cerebral Surface Measures with SES.
Maps are shown for the correlations of surface measures of the neonatal brain with SES. Results are FDR-corrected for multiple comparisons and shown in red and yellow are local protrusions and in blue and purple are local indentations of the cerebral surface, which are regarded as smaller or larger, respectively local volume of the cerebral surface. We found significant inverse correlations of local brain volumes in the infants with SES in the superior and middle occipital gyri primarily of the right hemisphere, parieto-occipital region of both hemispheres, middle frontal and temporal pole regions of the right hemisphere, and inferior frontal and anterior cingulate regions of the left hemisphere. We also detected significant positive correlations of local brain volumes in the infants with SES in the frontoparietal region of the right hemisphere and the inferior temporal lobe of the left hemisphere. The scatterplot of the inverse correlation with SES and surface measures of the SOG. Surface distances (in mm from the corresponding point on the surface template brain) are plotted on the y-axis. Blue scatter points represent SES values. Abbreviations: IFG – Inferior Frontal Gyrus; IOG – Inferior Occipital Gyrus; MFG – Medial Frontal Gyrus; MOG – Middle Occipital Gyrus; SOG – Superior Occipital Gyrus; TP – Temporal Pole.

