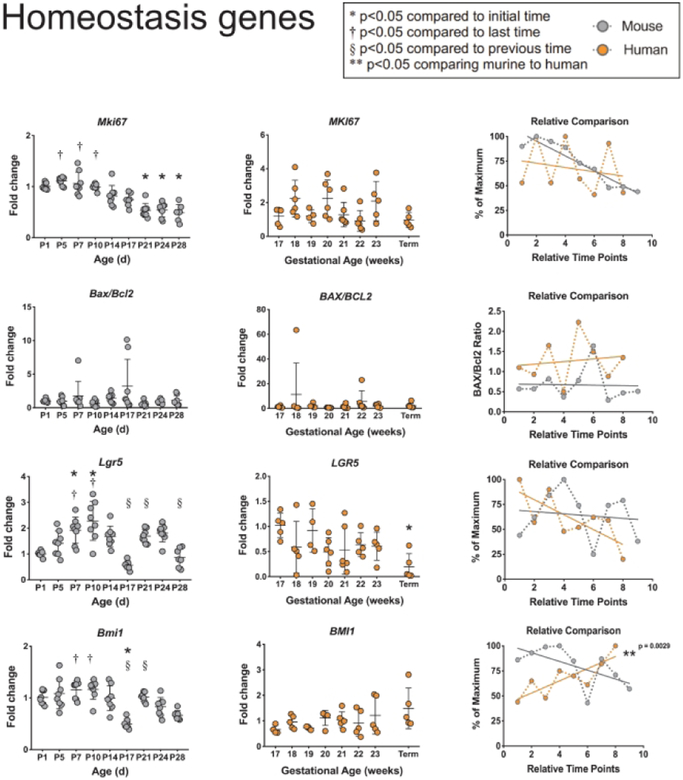
Figure 1: Comparison of homeostasis genes between murine and humans.
Homeostasis genesMKI67, BAX/BCL2, LGR5, and BMI1were evaluated in murine and human small intestines. Murine samples (far-left column in grey) show fold change with β-actinas a reference gene at ages shown (n=8 per group). Human samples (middle column in orange) show fold change with RPLO as a reference gene at ages shown (n=4–7). Significant differences are denoted as shown. Relative comparison (far-right column) of murine (grey) to human (orange) developmental trends as percent of maximum over time points. Linear regression was calculated to determine statistical significance between time points.

