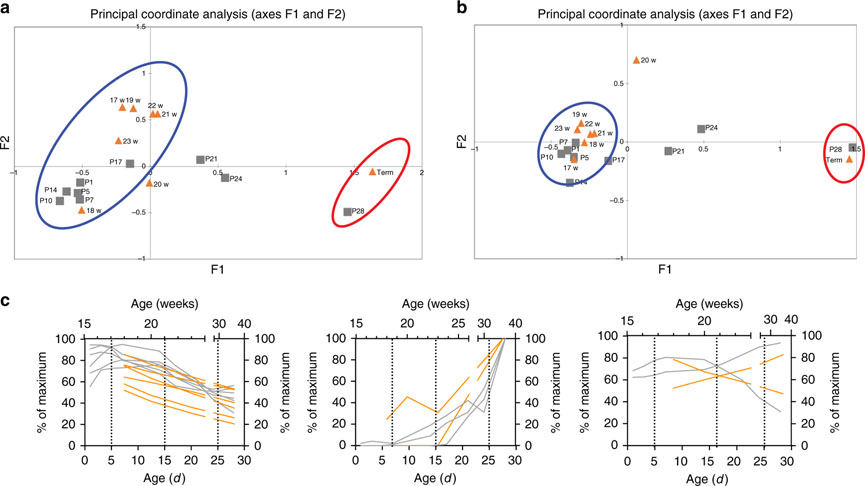
Figure 6: Direct age-based comparison of murine and human genes.
To determine age-based comparisons, a Principle Coordinate Analysis was generated using the maximum relative values from REG3γ/Reg3α, LYZ/Lyz 1, DEFA5/Defa, MUC2, TFF3, CDH1, OCLN1, MK167, CHGA, DCLK1, and LGR5 (A), and a second Principle Coordinate Analysis was generated using the maximum relative values fromREG3γ/Reg3α, LYZ/Lyz 1, DEFA5/Defβ, MUC2, TFF3, andCHGA(B) to determine relative similarities between developmental stages. In both analyses, murine genes from age P1–P17 were similar to human samples from age 17–23 weeks. To further delineate equivalent ages, the relative percentage of the maximum fold change was plotted to their developmental time points (days in murine samples and weeks in human samples) from CDH1, OCLN1, MKI67, CHGA, DCLK1, and LGR5 (left plot), REG3γ/Reg3α, LYZ/Lyz 1, and DEFA5/Defa (center plot), and MUC2, and TFF3 (right plot). An XY analysis was performed in GraphPad Prism to smooth the developmental curves. Murine (gray lines associated with the bottom X-axis and left Y-axis) and human plots (orange lines associated with the top X-axis and right Y-axis) were overlapped to describe the developmental stage similarities between the two species. Hashed lines were drawn to visually connect time points between mouse and human developmental stages.

