Figure 3.

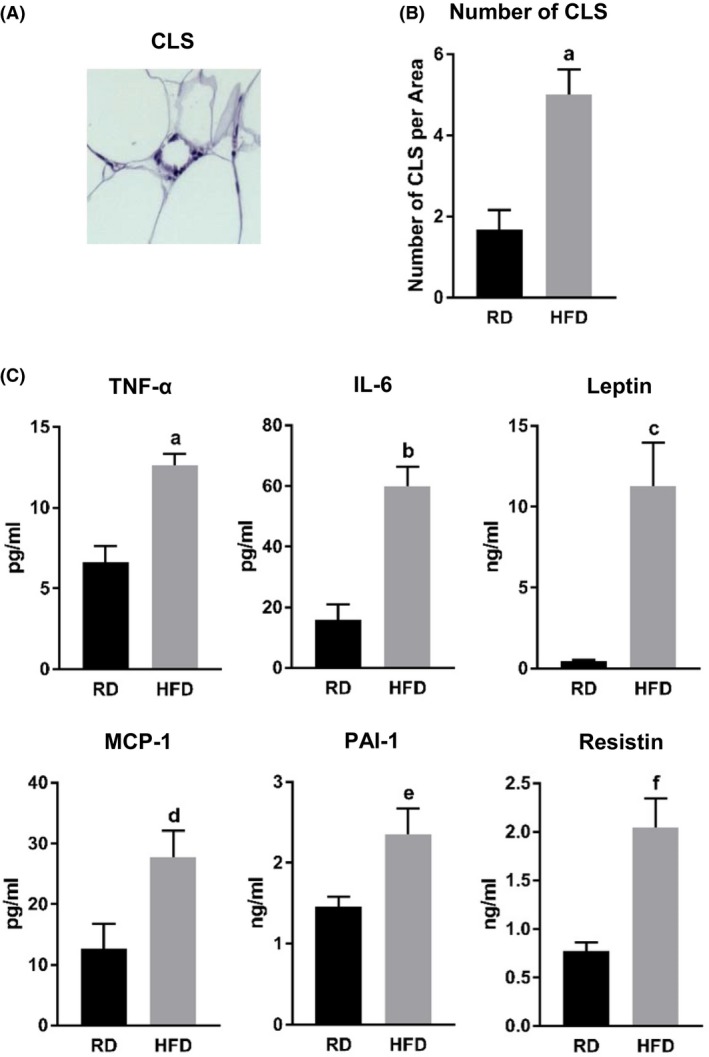
Effect of HFD on chronic inflammation. A, CLS. B, Comparisons between RD and HFD mice in number of CLS. Data are presented as number of CLS per visual microscope area. a, P = .0020. C, Fasting plasma levels of proinflammatory cytokines (TNF‐α, IL‐6, leptin, MCP‐1, PAI‐1, and resistin) measured by Luminex assay. a, P = .0209; b, P = .0002; c, P = .0024; d, P = .0328; e, P = .0151; f, P = .0008. Abbreviations: RD, regular diet; HFD, high‐fat diet; CLS, crown‐like structure; (TNF‐α), tumor necrosis factor‐alpha; IL‐6, interleukin‐6; MCP‐1, monocyte chemoattractant protein‐1; PAI‐1, plasminogen activator inhibitor‐1
