
Figure 1.
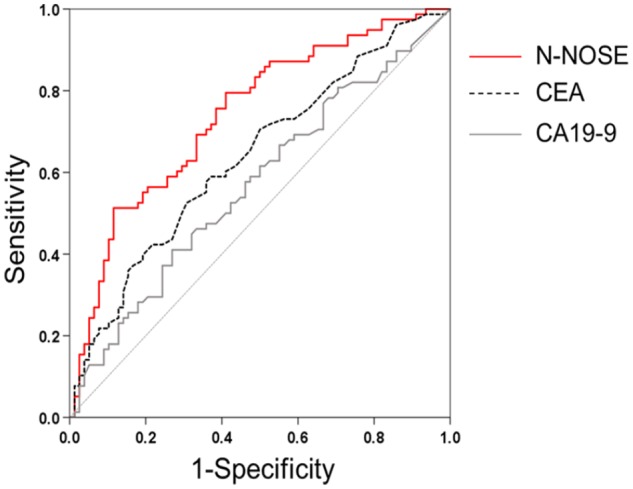
ROC curves depicting the diagnostic capability of N-NOSE.
Area under the ROC curve for N-NOSE (red line), CEA (black dotted line), and CA19-9 (grey line).
CA19-9 indicates carbohydrate antigen 19-9; CEA, carcinoembryonic antigen; N-NOSE, Nematode-NOSE; ROC, receiver operating characteristic.