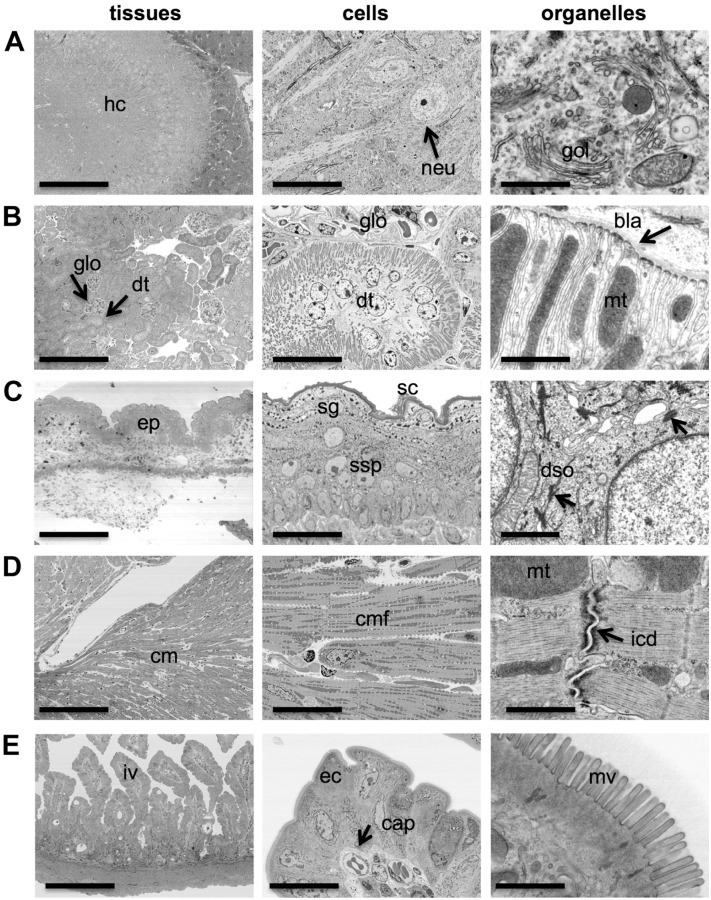
Figure 3.
Imaging a diversity of tissues from the tissue level to the organelle level. Tissues that are frequently encountered in research pathology were processed for BSE-SEM and imaged at the tissue level with a magnification of 250× (“tissues,” left panel), at the cellular level with a magnification of 2500× (“cells,” middle panels), and at the organelle level with a magnification of 50,000× (“organelles,” right panels). (A) Mouse hippocampus (hc) with neurons (neu, arrow) and Golgi apparatus (gol). (B) Mouse kidney cortex with marked glomerulus (glo, arrow), distal tubules (dt, arrow), mitochondria (mt), and basal lamina (bla, arrow). (C) Mouse skin epidermis (ep) with marked stratum corneum (sc), stratum granulosum (sg), stratum spinosum (sp), and desmosomes (dso, arrows). (D) Rat cardiac muscle (cm) with marked cardiac muscle fibers (cmf), mitochondria (mt), and intercalated disk (icd, arrow). (E) Mouse small intestine with marked villi (iv), enterocytes (ec), capillaries (cap, arrows), and microvilli (mv). Scale bars: 200 µm (A–E, left panels), 20 µm (A–E, middle panels), and 1 µm (A–E, right panels). Abbreviation: BSE-SEM, backscattered electron scanning electron microscopy.

