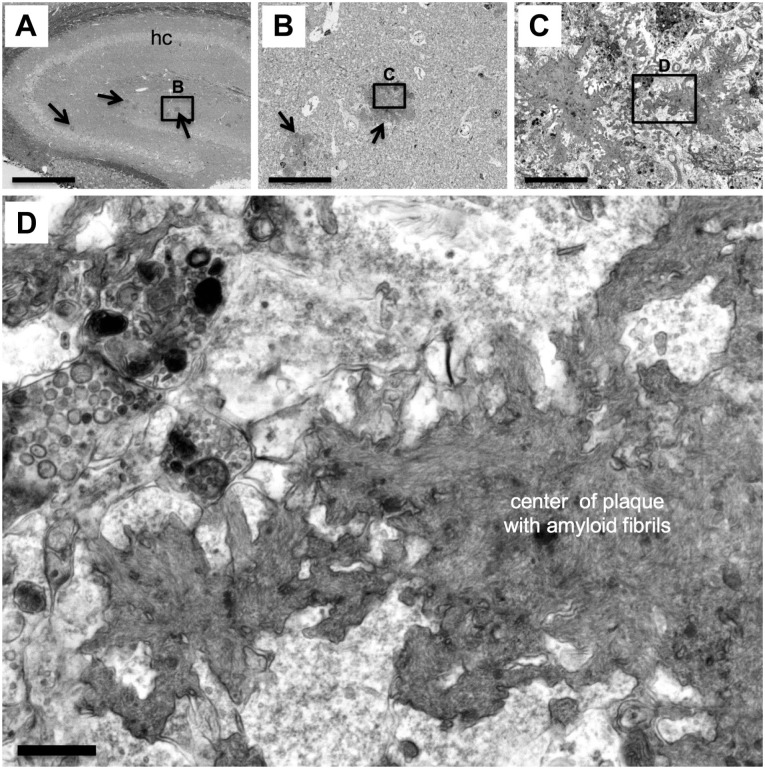
Figure 5.
Identification of amyloid plaques in the PS2APP mouse model of Alzheimer’s disease. (A–D) Slices of brain tissue from the PS2APP mouse model of Alzheimer’s disease were processed for BSE-SEM. (A) The hippocampus (hc) was first investigated at very low magnification (100×) to search and map the position of putative amyloid plaques (arrows). An area in (A) containing putative plaques (black rectangle) was then further investigated. (B) View of the area in the rectangle in (A) at higher magnification (1000×) revealing the dense core and the “lobed” peripheral shape of the putative amyloid plaque. (C) View of the area in the rectangle in (B) at higher magnification (10,000×) showing tree-like dark aggregates in the center of the amyloid plaque. Cytoplasmic processes and structures reminiscent of giant dystrophic neurites (top) filled with dark autolytic vesicles are also visible. (D) At a magnification of 40,000× and a pixel size of 2 nm, individual amyloid fibrils became visible, revealing the “fibrillar texture” of the center of the plaque. Scale bars: (A) 500 µm, (B) 50 µm, (C) 5 µm, and (D) 500 nm. Abbreviation: BSE-SEM, backscattered electron scanning electron microscopy.

