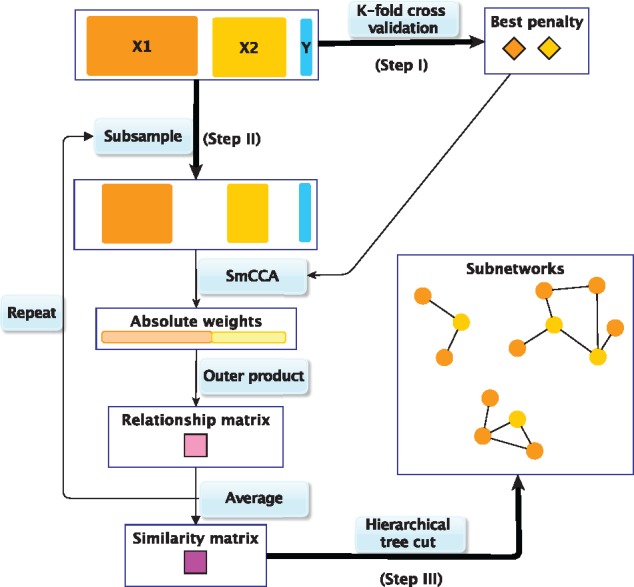
Fig. 1.

SmCCNet work flow overview. X1, X2 and Y indicate mRNA expression levels, miRNA expression levels and phenotype measurements, respectively. Step I: Identify the best penalty pair through a K-fold CV. Step II: Randomly subsample (omics) features without replacement, apply SmCCA with the chosen penalties and compute a feature relationship matrix for each subset. Repeat the process many times and define the similarity matrix to be the average of all feature relationship matrices. Step III: Apply a hierarchical tree cut to the similarity matrix to find the multi-omics networks
