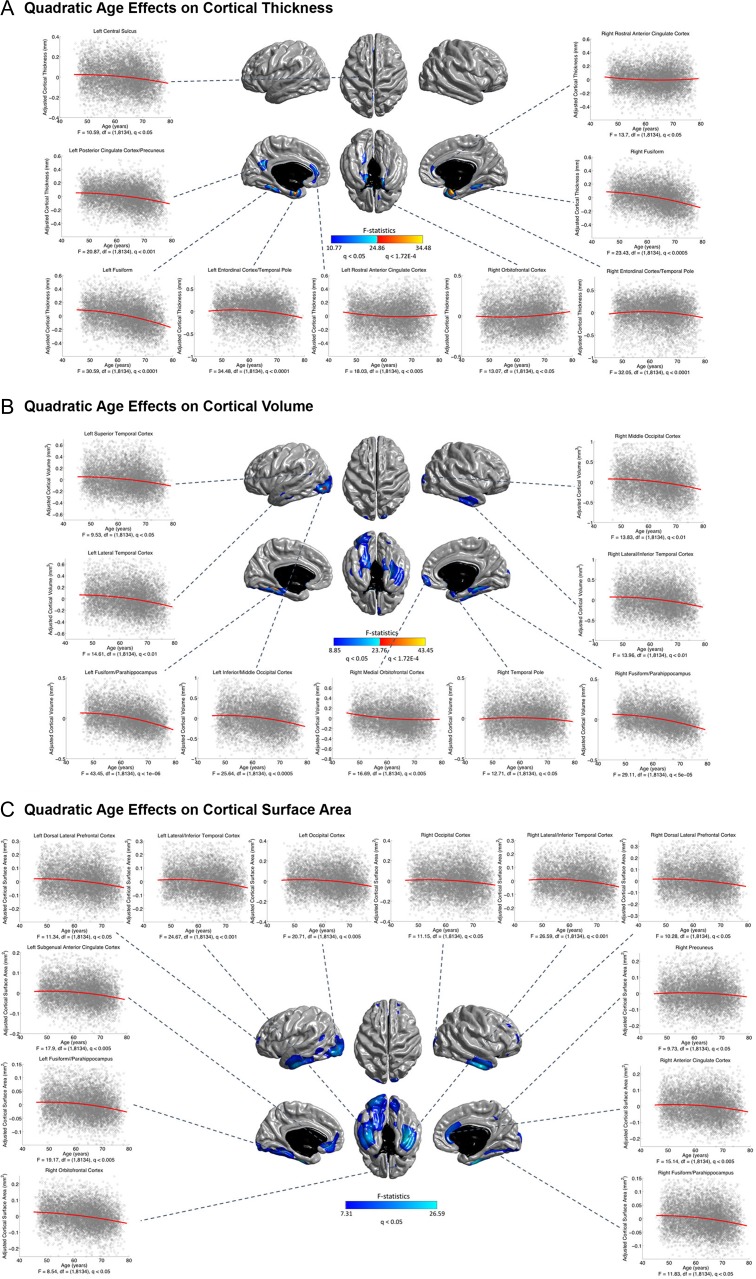
Figure 1.
Quadratic age effects on cortical thickness (CTh) (A), volume (CVo) (B), and surface area (CSA) (C) throughout the cerebral cortex. Color bar represents F-statistics. Areas in blue-cyan represent patterns at the exploratory level of q < 0.05, areas in red-yellow represent patterns at the conservative level of q < 1.72E-4. Fitted quadratic trajectories are depicted for vertices with maximum F-statistics in clusters (x-axis = age (years), y-axis = cortical morphological measures adjusted for sex and intracranial volume).

