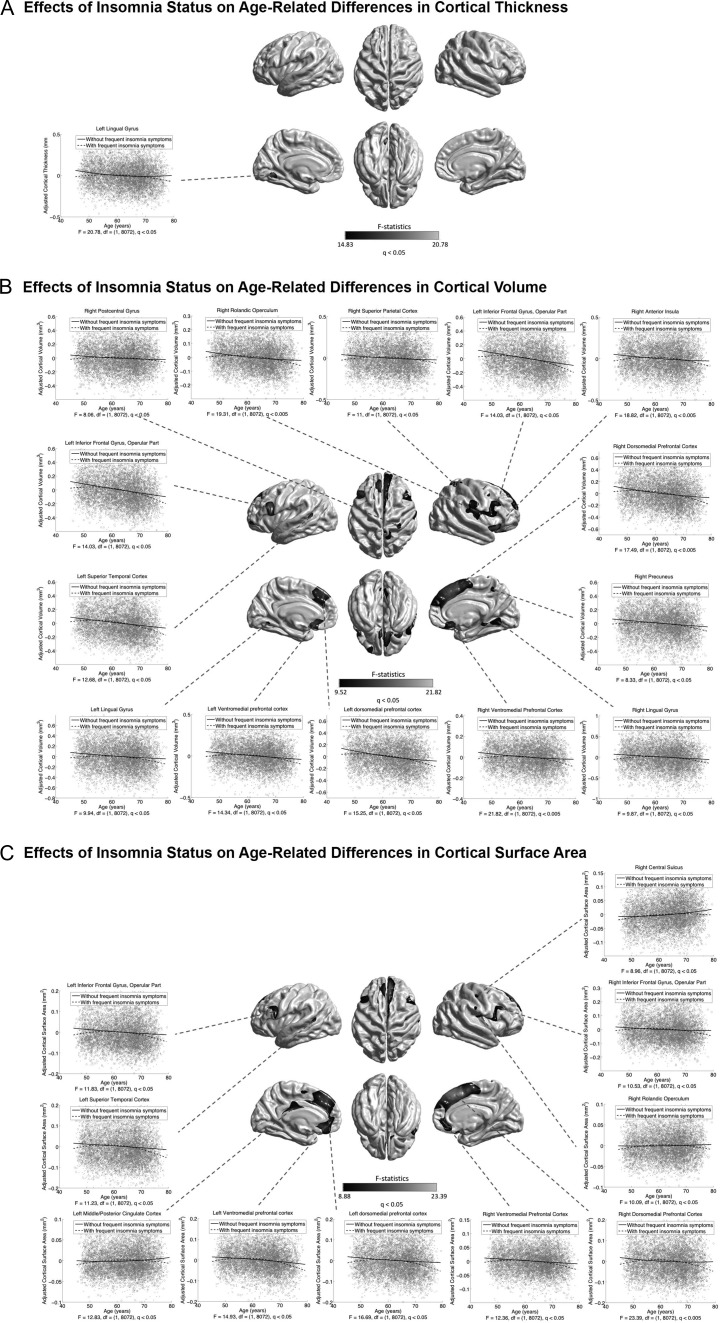
Figure 9.
Associations between insomnia status and age-related differences in CTh (A), CVo (B), and CSA (C). Grayscale bar represents F-statistics. Areas in black-lightgray represent patterns at the exploratory level of q < 0.05. Fitted age trajectories for individual with frequent insomnia symptoms (dashed lines) and without frequent insomnia symptoms (solid lines) are depicted for vertices with maximum F-statistics in clusters (x-axis = age (years), y-axis = cortical morphological measures adjusted for sex and intracranial volume).

