
Fig. 2.
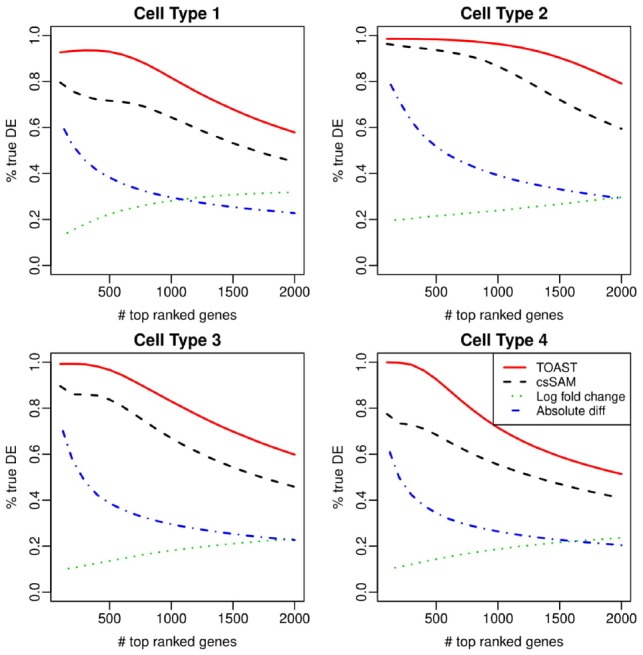
Comparison of csDE detection accuracy from simulation. Shown are the TDR curves, which plot the proportions of true discovery among top-ranked genes against the number of top-ranked genes. Methods under comparison include TOAST, csSAM, lfc and absolute difference