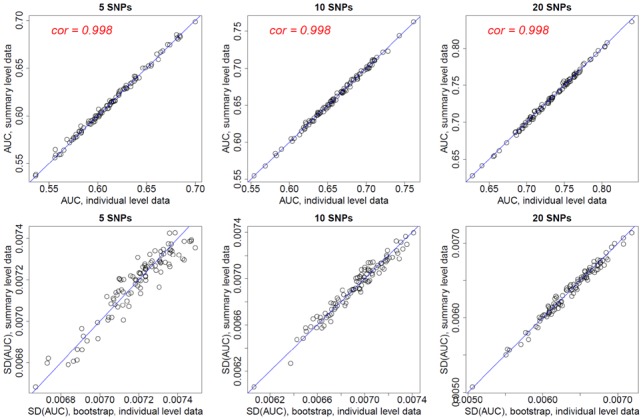
Fig. 2.

AUC values and the standard errors for PRS with independent SNPs based on simulation study. Each data point represents one simulation. For each simulation, we calculated the AUC and its variance based on individual data (x-coordinate) and using SummaryAUC (y-coordinate)
