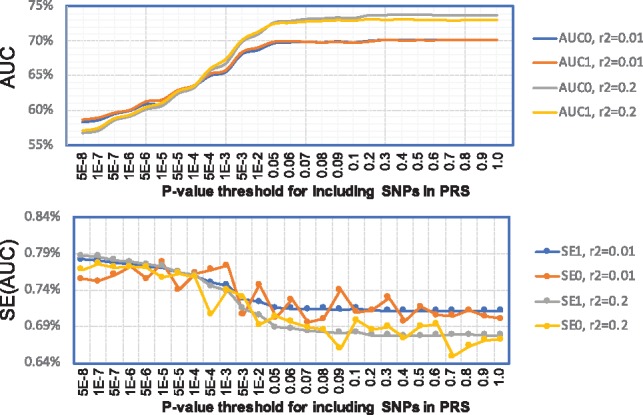
Fig. 3.

AUC values and their standard errors for PRS of schizophrenia for genotyped SNPs in the MGS study. PRSs were trained based on the PGC summary data excluding the MGS study; the MGS study was used as the validation data for calculating AUC and its variance. Analysis was restricted to SNPs genotyped in MGS. The x-coordinate is the P-value threshold (for training dataset) for including SNPs in PRS. AUC0 and SE0 were calculated using individual level data. AUC1 and SE1 were calculated using SummaryAUC based on GWAS summary data in MGS. : SNPs were LD-clumped using in PLINK. : SNPs were LD-clumped using in PLINK
