
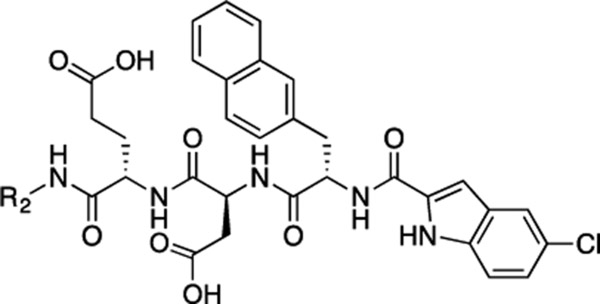
Table 2.
FP Competitive Inhibition Assay Results of Inhibitors 20–38a
 | |||||||
|---|---|---|---|---|---|---|---|
| No. | R2 | IC50 ± SD (μM) | Ki ± SD (μM) | No. | R2 | IC50 ± SD (μM) | Ki ± SD (μM) |
| 20 | 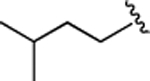 |
33 ± 3.8 | 8.5 ± 0.98 | 30 | 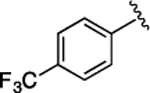 |
7.3 ± 0.78 | 1.9 ± 0.20 |
| 21 | 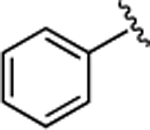 |
13 ± 2.5 | 3.3 ± 0.64 | 31 | 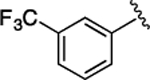 |
8.9 ± 0.68 | 2.3 ± 0.17 |
| 22 | 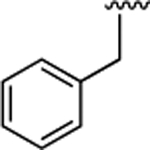 |
30 ± 3.7 | 7.6 ± 0.94 | 32 | 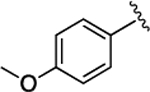 |
10 ± 1.4 | 2.6 ± 0.37 |
| 23 | 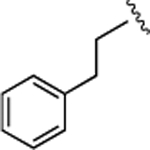 |
35 ± 3.6 | 8.9 ± 0.91 | 33 | 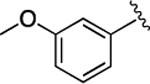 |
9.3 ± 1.2 | 2.4 ± 0.31 |
| 24 | 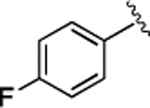 |
17 ± 3.4 | 4.5 ± 0.88 | 34 | 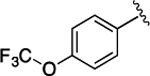 |
7.5 ± 0.51 | 1.9 ± 0.13 |
| 25 | 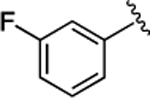 |
13 ± 1.5 | 3.3 ± 0.37 | 35 | 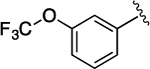 |
8.5 ± 0.60 | 2.2 ± 0.15 |
| 26 | 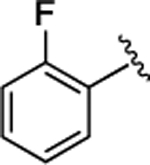 |
14 ± 2.9 | 3.6 ± 0.74 | 36 | 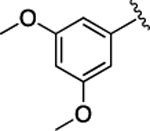 |
13 ± 1.1 | 3.3 ± 0.26 |
| 27 | 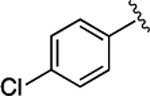 |
11 ± 2.0 | 2.7 ± 0.50 | 37 | 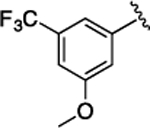 |
10 ± 0.81 | 2.6 ± 0.20 |
| 28 | 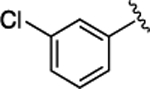 |
12 ± 2.0 | 3.1 ± 0.51 | 38 | 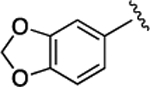 |
9.8 ± 3.3 | 2.5 ± 0.83 |
| 29 | 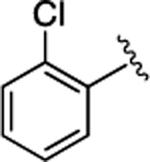 |
38 ± 8.4 | 9.6 ± 2.1 | ||||
a
Each set of data was expressed as mean ± standard deviation (n = 3). The Ki value for the parent peptide G13ANDE17 was determined to be 290 ± 1.3 μM.36