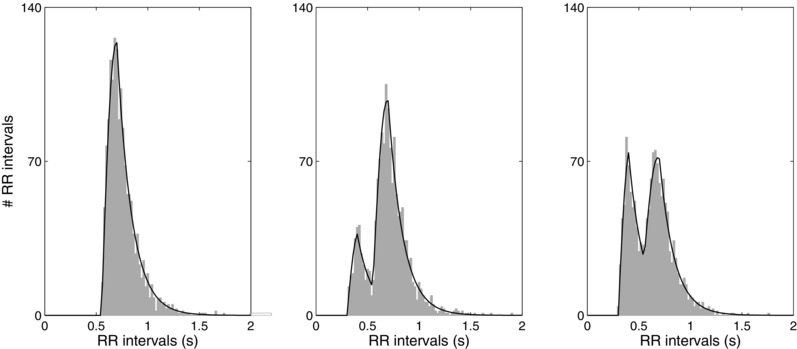
Figure 2.

Collection of RR intervals histograms and fitted statistical models (solid line), which reflect different parameter settings. The histograms derive from data with increasing probability of an atrial impulse to pass through the slow pathway (probabilities 0, 0.25, and 0.5); the other AV nodal parameters are held constant.
