
Figure 3.
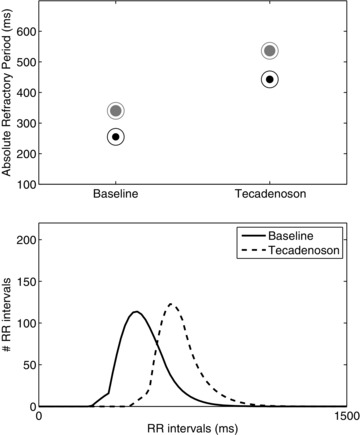
Example of results from a patient from the group with 300 μg dose. Top panel: refractory periods of the slow (black circles) and fast (gray circles) pathways in the protocol phases: the filled part of the marker is proportional to the probability of atrial impulses to pass through that pathway. Bottom panel: the estimated PDFs from the different protocol phases.