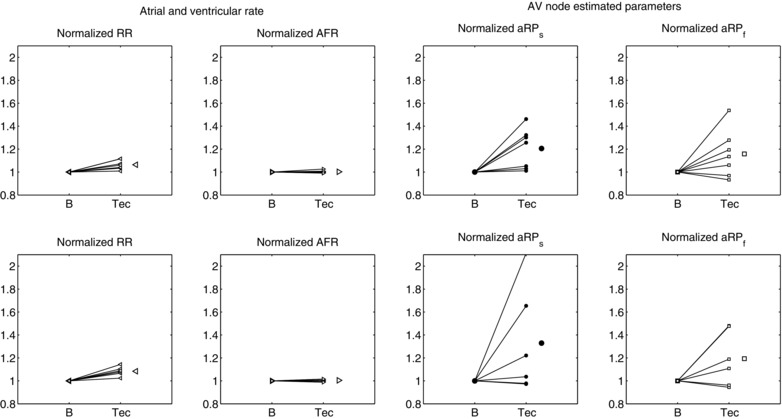
Figure 4.

Normalized heart rate (HR), AF rate (AFR), and absolute refractory period of the slow (aRP) and fast (aRP) pathways in the two groups of patients (top row dose 75, bottom row dose 300). In each plot, the single patient response and the average response are shown. *P < 0.05.
