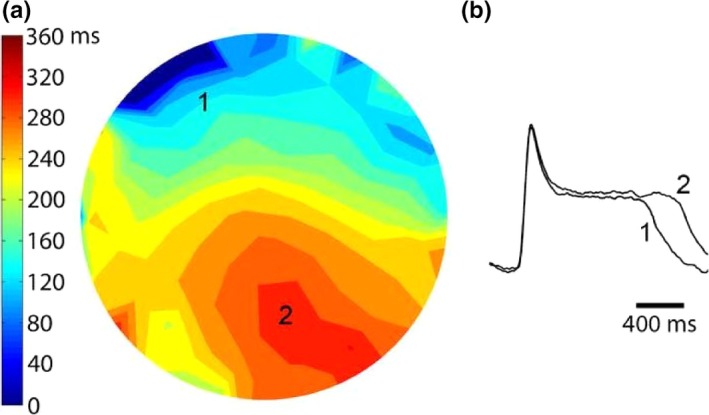
Figure 3.

Panel (a) illustrates the repolarization map of the S1 beat that preceded the onset of spiral wave reentry shown in Figure 2. Isochrones of FCaiD85 were mapped at 40 ms duration. The line of functional propagation block around which the spiral wave reentry circulated developed at zones of crowded isochrones reflecting spatial dispersion of FCaiD85. Panel (b) shows two representative FCai signals recorded from two pixels in isochrones 160 and 360 ms and illustrate a 200 ms difference in FCaiD85
