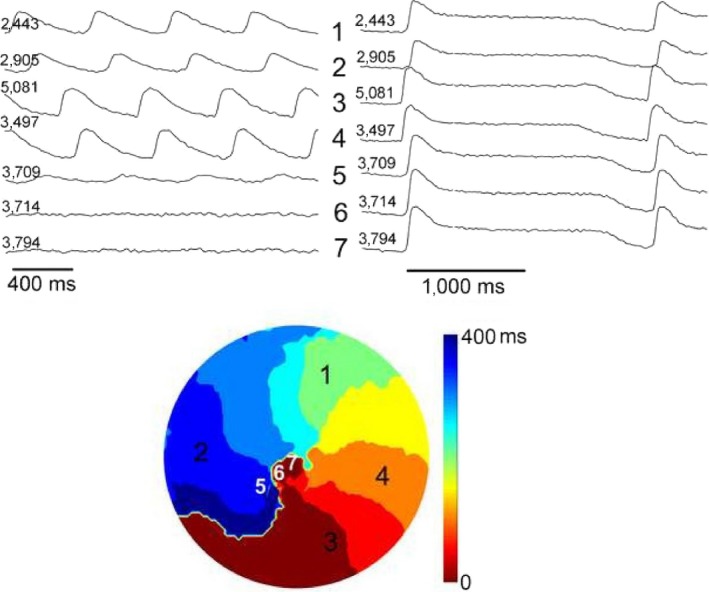
Figure 4.

Illustrates the nature of FCai potentials in the core of the spiral wave reentry. The left panel illustrates selective FCai signals during sustained spiral wave reentry. The right panel illustrates the same signals during stimulation at 0.5 Hz. During reentry, there was a 2 mm diameter confluent zone of steady‐state small oscillations (sites 6 and 7). The approach to this zone showed low amplitude signals (site 5). The core of the spiral is made of a small area of tissue, which is depolarized and refractory, thus constituting a functional obstacle. This area is functionally normal during regular stimulation as shown in the right panel
