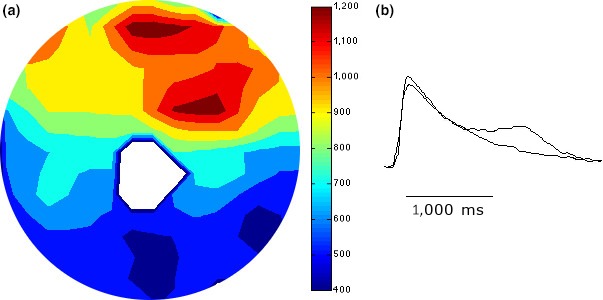
Figure 5.

Panel (a) was obtained from a monolayer with a fixed anatomical obstacle and illustrates the FCaiD85 map of the S1 stimulus that preceded the onset of spiral wave reentry. The figure shows a zone of spatial dispersion of FCaiD85 that extends from the central anatomical obstacle to the edge of the monolayer along the 2 o'clock line. Panel (b) illustrates two representative recordings of FCai from opposite sides of the zone of crowded isochrones. The FCaiD85 was 1,505 and 1,940 ms, respectively
