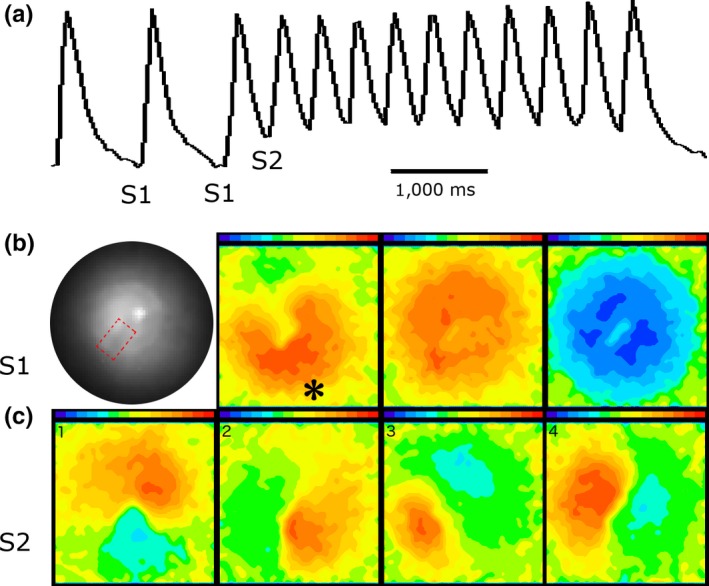
Figure 7.

The figure illustrates the initiation and spontaneous termination of spiral wave reentry from a different monolayer with a fixed anatomical core. Panel (a) shows FCai recordings from one pixel that illustrates the last three of a series of 10 S1 stimuli at a CL of 1 Hz followed by an S2 stimulus that initiated a train of nine cycles of spiral waves that terminated spontaneously. Panel (b) consists of four sections. The section on the left is a low power fluoroscopic image of the monolayer that illustrates the anatomical obstacle that was created in the middle of the monolayer by scraping the cells from a 2 × 3 mm section (visible as a darker zone in the fluoroscopic image compared to the rest of the monolayer and is delineated by dotted line). The remaining three sections illustrate the FCai wave front of the S1 stimulus. The propagation of FCai signal is represented in red while the absence of FCai signals in the monolayer is represented in blue. The site of the S1 stimulus is marked by an asterisk. The advancing FCai wave front circulated around the anatomical obstacle (section 2) and propagated quickly within less than 40 ms to the rest of the monolayer (section 3) before the monolayer became quiet during the interval between successive S1 stimuli (labeled blue). Panel (c) illustrates sequential recordings of the clockwise rotating FCai wave front (consecutive sections 1 to 4) representing spiral wave reentry
