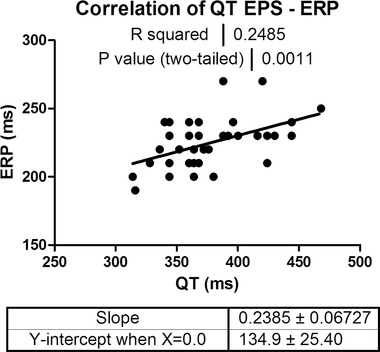
Figure 2.

Correlation between ERP and QT. Pearson correlation of invasively measured ERP during EPS and QT measured at the beginning of EPS (N = 40): data indicating that there is a moderate (R2 = 0.25) but highly significant correlation between ERP and QT‐interval (P = 0.001). ERP = effective refractory period; EPS = electrophysiological study.
