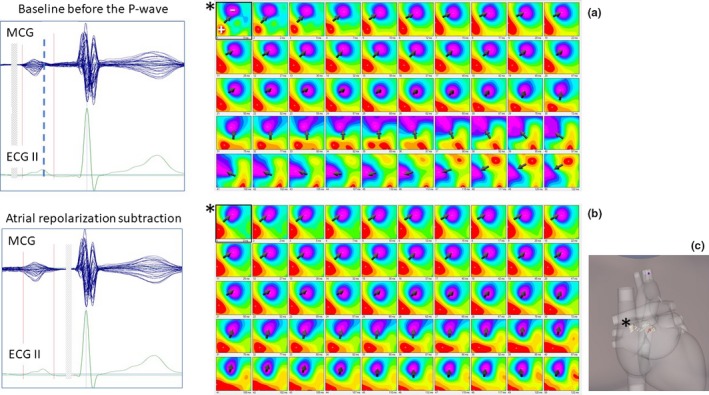
Figure 2.

(a) Time‐variant dynamics of the MF distribution during the whole P‐wave. Typical inversion of the MF polarity is evident during the P‐wave descending limb (thick dashed line). (b) After subtraction of atrial repolarization MF, residual MF distribution consistent with the underlying atrial depolarization is unmasked. (c) Inverse EMD localization within the 3D heart model shows a trajectory consistent with atrial depolarization from the right (* PW onset) to the left atrium
