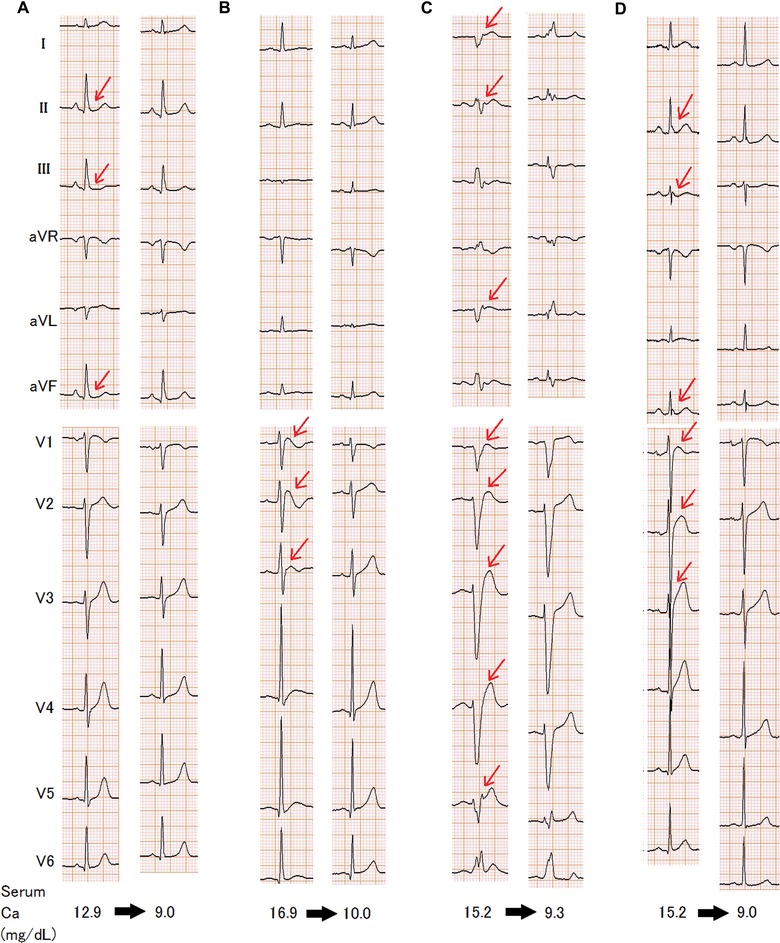
Figure 2.

Representative 12‐lead ECGs in both hypercalcemic (left side) and normal calcium states (right side). (A) Patient 10; (B) Patient 18; (C) Patient 25; (D) Patient 27. Patient numbers correspond to those listed in Table 3. The arrows indicate J point elevation. Serum Ca+ level was corrected using the serum albumin level.
