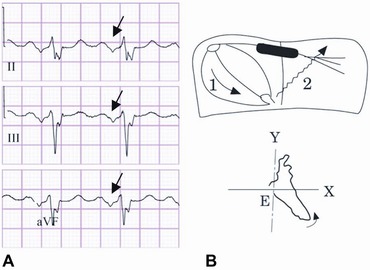
Figure 1.

(A) Typical ECG of aIAB with P‐wave duration >120 milliseconds and biphasic morphology in inferior leads (see arrow). (B) Diagram of atrial conduction showing block of the electrical impulse in the upper and middle part of the interatrial septum and retrograde LA activation via muscular connections in the vicinity of coronary sinus (modified from Yamada et al.15).
