
Figure 1.
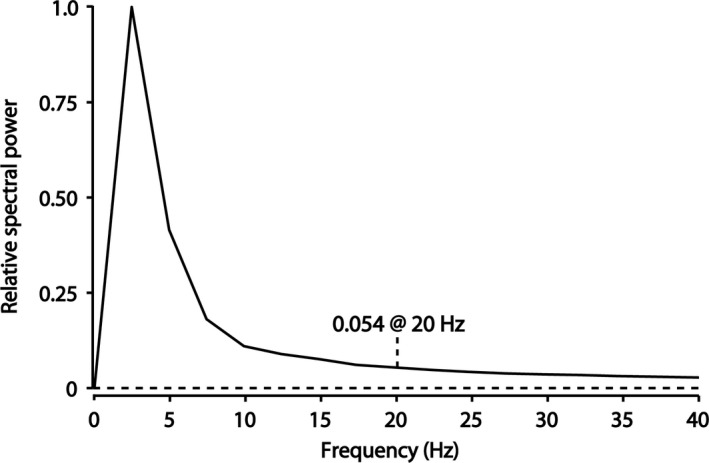
The average amplitude spectral density for all T waves in the dataset. There is little frequency content above 20 Hz so a sampling frequency of 40 Hz is sufficient to reliably represent the T wave. T waves were down‐sampled to 20 discrete sample values and since the interval between those 20 points was always <500 ms, this number of samples corresponded to a sample frequency of more than 40 Hz