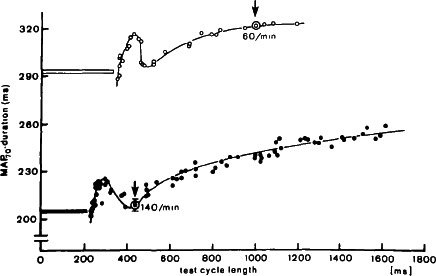
Figure 2.

Electrical restitution curves at two different pacing rates. The circled data points (marked by arrows) show steady‐state responses (mean ± 1 SD) at indicated rate. The horizontal bar before each curve indicates the duration of membrane depolarization above 70% as part of the test cycle length. From Franz et al. (1983)
