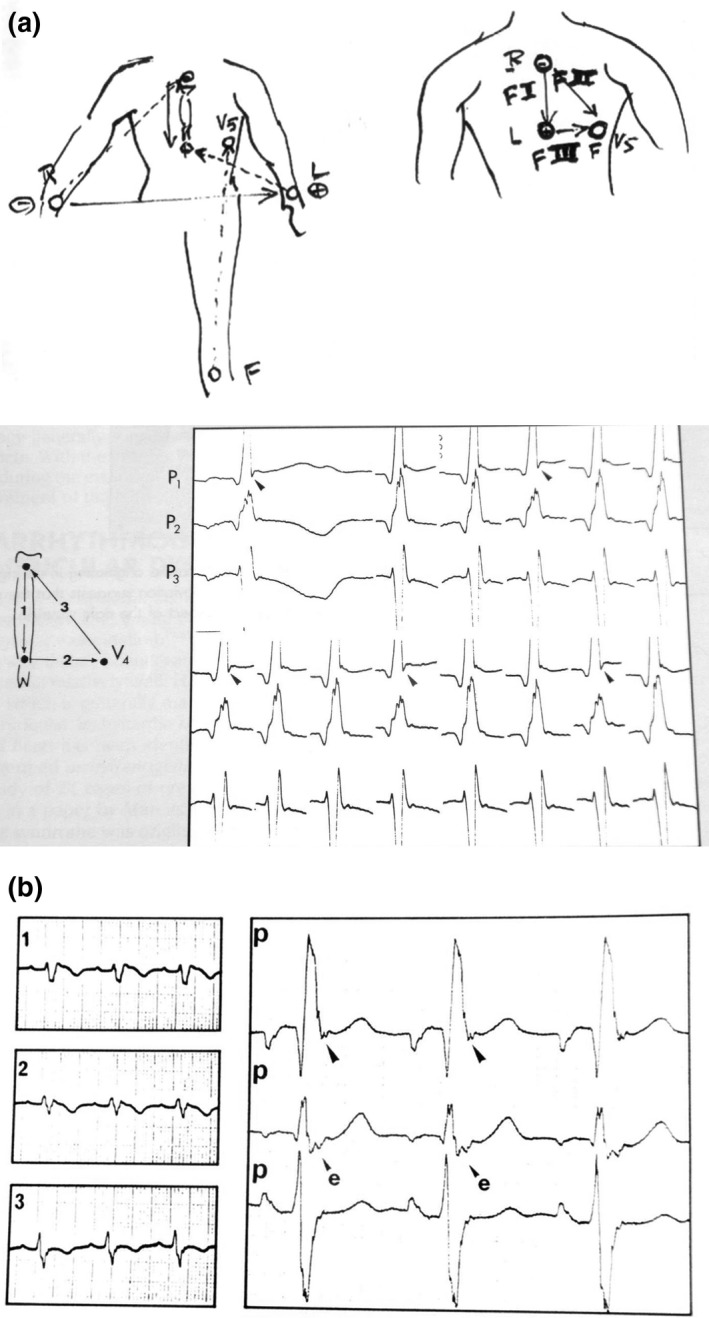
Figure 2.

(a) Top, the first sketch presented the “F” leads (left) but later abandoned by modesty for the book illustration (right). Below, documents published in the Chatterjee and Parmley's book: Recording is performed at double speed and high amplification. There is obvious fragmentation of the top of the QRS complex. Note an intermittent small S wave. “P” means precordial lead. “F” leads are on the sketch. (b) The Fontaine lead shows an Epsilon wave located at the end of the QRS complex recorded with the same technique as before but compared with the regular V1–3 ECG tracing on the left
