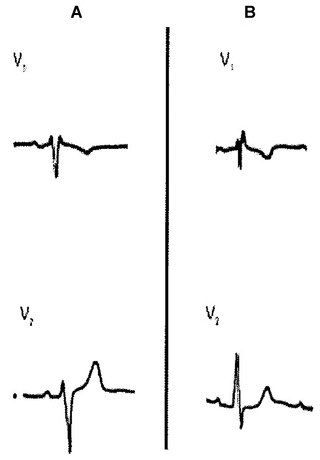
Figure 2.

Two cases of rSr’ in lead V1 without associated heart disease. In panel A, note r’ = r and P wave with a ± morphology in lead V1. In panel B, the morphology of the P wave is also ± in lead V1 but r < r’. In an isolated tracing it is not possible to distinguish between the proximal origin in partial RBBB or peripheral RV delay (see text).
