Figure 4.

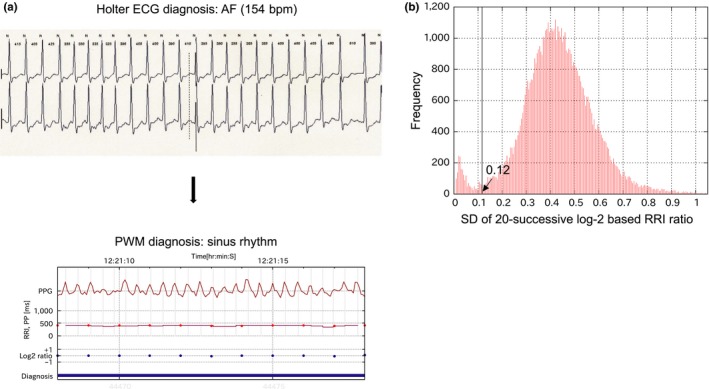
(a) Example of recording AF with a high ventricular response. The upper figure is holter ECG showing AF (heart rate 154 bpm). In the lower figure, pulse period (RR interval) series had low dispersion, as shown by red dot line and blue dot line (standard deviation [SD] of 20‐successive log2‐based RR interval [RRI] ratios: 0.11). The diagnosis from the pulse wave monitor was falsely sinus rhythm, indicated with blue bar at the bottom. (b) The frequency of the SD of 20‐successive log2‐based RRI ratios during AF exhibited a bimodal distribution (pilot data). AF with a very low SD of 20‐successive log2‐based RRI ratios was likely to be regarded as sinus rhythm
