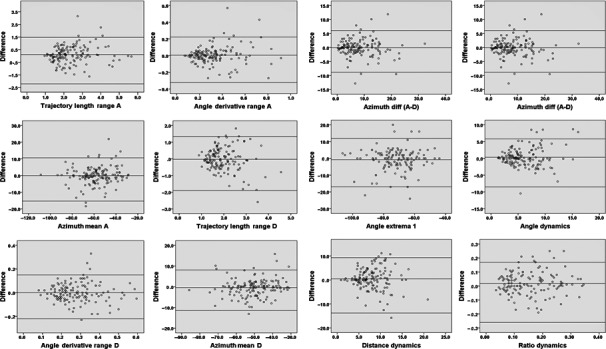
Figure 3.

Bland–Altman Plots of VR parameters. The average value of two measures and their difference are plotted, respectively, on the x‐ and on the y‐axis. Central horizontal line corresponds to the average of differences while the line above and the line below represent the average of differences ±1.96 SD: more points fall within the two outside lines is greater repeatability
