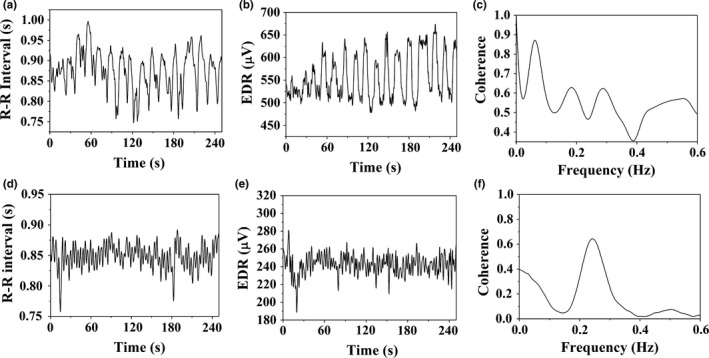
Figure 1.

(a) A portion of the R‐R interval time series of a yogic subject (b) the corresponding EDR signal extracted from the ECG‐R‐wave magnitudes (c) coherence measured between the signals in (a) and (b). Similar plots generated from a control subject are shown in (d)–(f)
