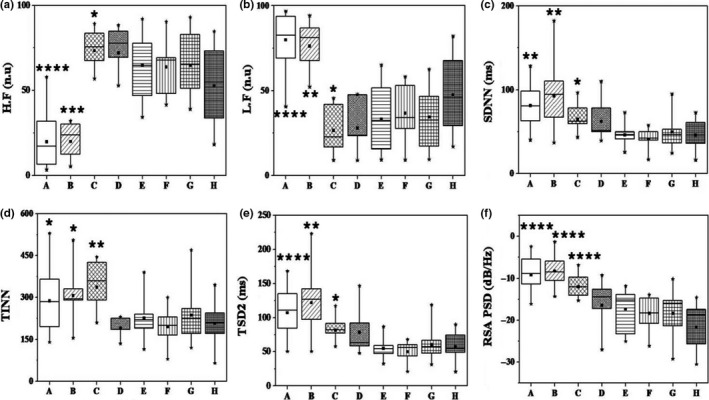
Figure 3.

Comparison of HRV parameters and PSD of RSA in yogic group, paced breathing group at 3, 7, and 12 cpm, focused attention group with three tasks and normal breathing control group; indicated, respectively, from A, B, C, D, E, F, G, and H. Statistical levels of significance calculated by comparing each study group against the control group are indicated as star marks. Star marks from one to four represent p < 0.05, p < 0.01, p < 0.001, and p < 0.0001
