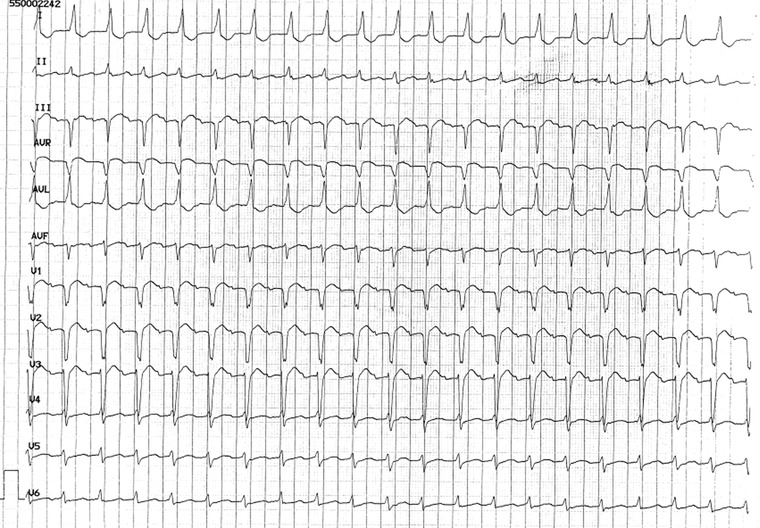
Figure 7.

A 2:1 atrial tachycardia with only one visible P wave (other P is concealed by QRS complex). Diagnosis is prompted by: PR = RP interval, P wave visible only in some leads and upsloping PR segment in II lead. Moreover, II lead shows a QRS complex followed by the end P wave.
