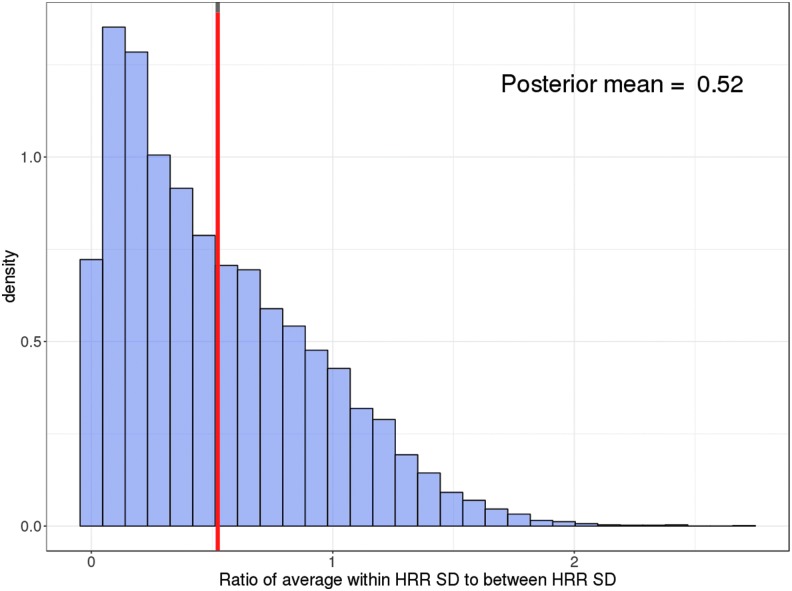
FIG. 3.
Histogram for the relative variation of hospice use within HRRs. For each posterior draw, we calculated within variation as the weighted SD of the estimated county effects within each HRR, and between variation as the SD of the HRR fixed effects. The relative variation is the ratio of within-HRR variation to the between-HRR variation. HRR, hospital referral region; SD, standard deviation.

