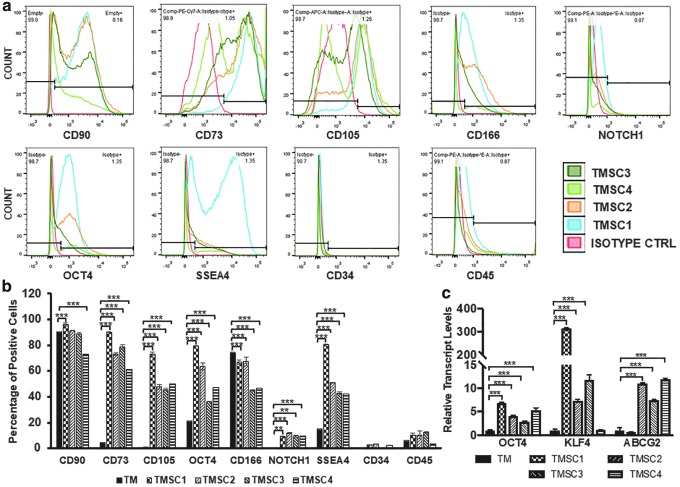
FIG. 1.
Expression of stem cell markers in cryo-TMSCs after revival. (a) Flow cytometry histograms showing the positive percentage for different antibodies. (b) Bar diagram showing a comparison of stem cell marker expression of different TMSCs by flow cytometry, statistical comparison was made with reference to primary TM cells. (c) Bar diagram showing the qPCR results for various stem cell genes. Statistical comparison was made with reference to primary TM cells. **P < 0.001, ***P < 0.0001. qPCR, quantitative polymerase chain reaction; TM, trabecular meshwork; TMSCs, trabecular meshwork stem cells. Color images are available online.

