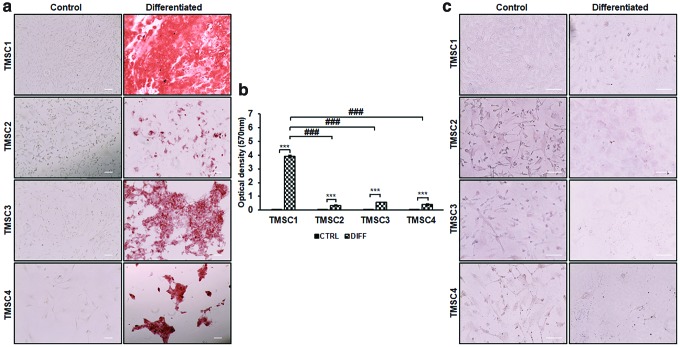
FIG. 4.
Osteogenic and adipogenic differentiation potential of cryo-TMSCs. (a) Alizarin red stained undifferentiated (Control) and differentiated cells with osteogenic induction. (b) Bar diagram showing quantification of the optical density of stained alizarin red for osteogenic differentiation. ***Comparison between control and differentiated cells. ###Comparison between differentiated cell types with reference to TMSC1. ***/###P < 0.0001. (c) Cells stained with Oil Red O postadipogenic differentiation. Scale bars, 100 μm. Color images are available online.

