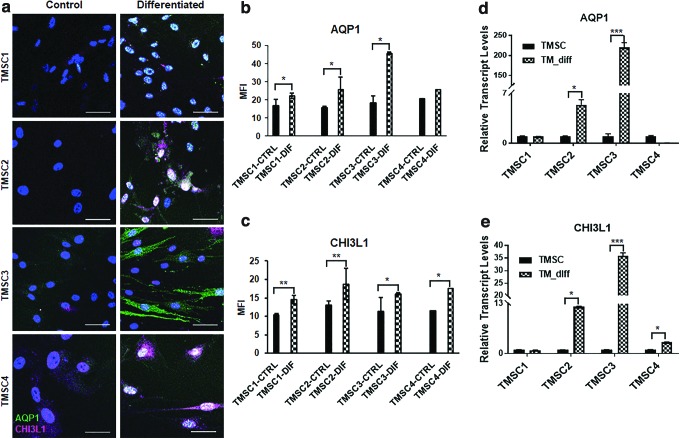
FIG. 6.
TM cell differentiation of cryo-TMSCs. (a) Immunofluorescent staining of AQP1 (green) and CHI3L1 (magenta) in control and TM differentiated cells. Scale bars, 50 μm. (b, c) Quantification of MFI for AQP1 and CHI3L1, respectively, (d, e) qPCR analysis showing a comparison of the gene expression profile of TM markers AQP1 and CHI3L1 pre-/post-TM differentiation. *P ≤ 0.05, **P ≤ 0.001, ***P ≤ 0.0001. Color images are available online.

