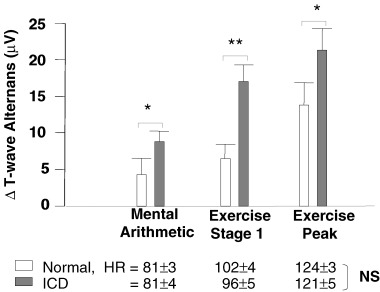
Figure 4.

Comparison of ICD patients with controls in T‐wave alternans responses to mental stress and exercise (Δ= change from baseline). Increases in TWA were higher in ICD patients than in controls during mental arithmetic (P = 0.043), exercise stage 1 (P = 0.0004), and peak exercise (P = 0.038). *P <0.05, **P <0.01 (ICD vs control). (Adapted with permission from Lippincott, Williams & Wilkins from Ref. 26.)
